

Asia accounts for 33.4% of annual global CO₂ emissions and has accumulated 899 billion tonnes historically, more than North America and Europe combined. Across all three greenhouse gases, CO₂, methane, and nitrous oxide, one pattern is unmistakable: Asia leads, and the gap is widening.

How China’s Compressed Industrialization Is Reshaping the Historical Carbon Balance Against the USA and UK (1850–2024)

From Pre-Industrial Baselines to Modern Industrial Pressures: A Century-Scale Analysis of Carbon Dioxide, Methane, and Nitrous Oxide Trends Across the Continent
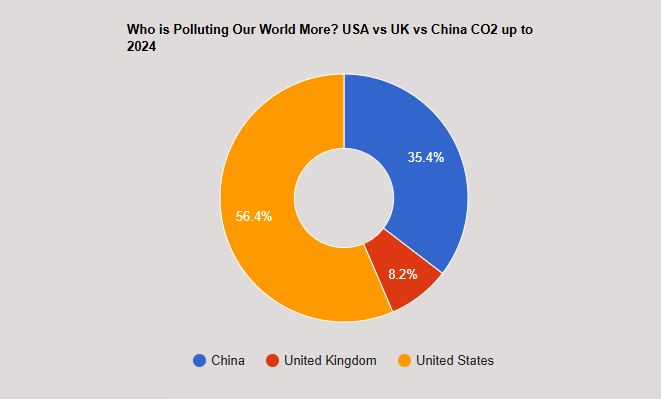
While modern headlines focus on today’s largest emitters, a look at the cumulative data from 1850 to 2024 reveals a different story of responsibility: Who has contributed most to the atmosphere we share?
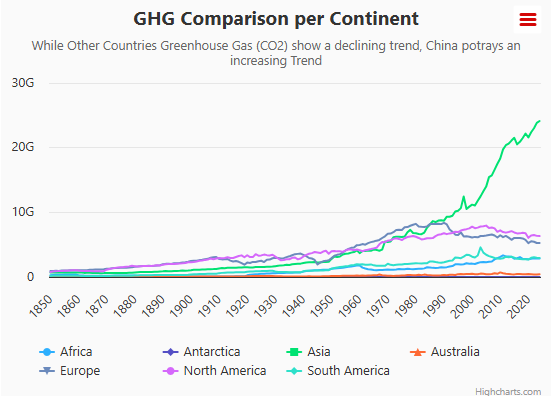
While the rest of the world bends the curve downward, Asia's greenhouse gas emissions are racing in the opposite direction — and the gap is widening fast.
- Asia Alone Produces a Third of the World's CO₂, And Has Emitted Nearly 900 Billion Tonnes Historically
- CO₂ Output Between the USA, China, and the UK (1850–2024)
- Africa Green House Gas Emmission Trends
- Who is Polluting Our World More? USA vs UK vs China
Asia Alone Produces a Third of the World's CO₂, And Has Emitted Nearly 900 Billion Tonnes Historically
21 May 2026
Asia accounts for 33.4% of annual global CO₂ emissions and has accumulated 899 billion tonnes historically, more than North America and Europe combined. Across all three greenhouse gases, CO₂, methane, and nitrous oxide, one pattern is unmistakable: Asia leads, and the gap is widening.
CO₂ Output Between the USA, China, and the UK (1850–2024)
21 May 2026
How China’s Compressed Industrialization Is Reshaping the Historical Carbon Balance Against the USA and UK (1850–2024)
Africa Green House Gas Emmission Trends
21 May 2026
From Pre-Industrial Baselines to Modern Industrial Pressures: A Century-Scale Analysis of Carbon Dioxide, Methane, and Nitrous Oxide Trends Across the Continent
Who is Polluting Our World More? USA vs UK vs China
21 May 2026
While modern headlines focus on today’s largest emitters, a look at the cumulative data from 1850 to 2024 reveals a different story of responsibility: Who has contributed most to the atmosphere we share?